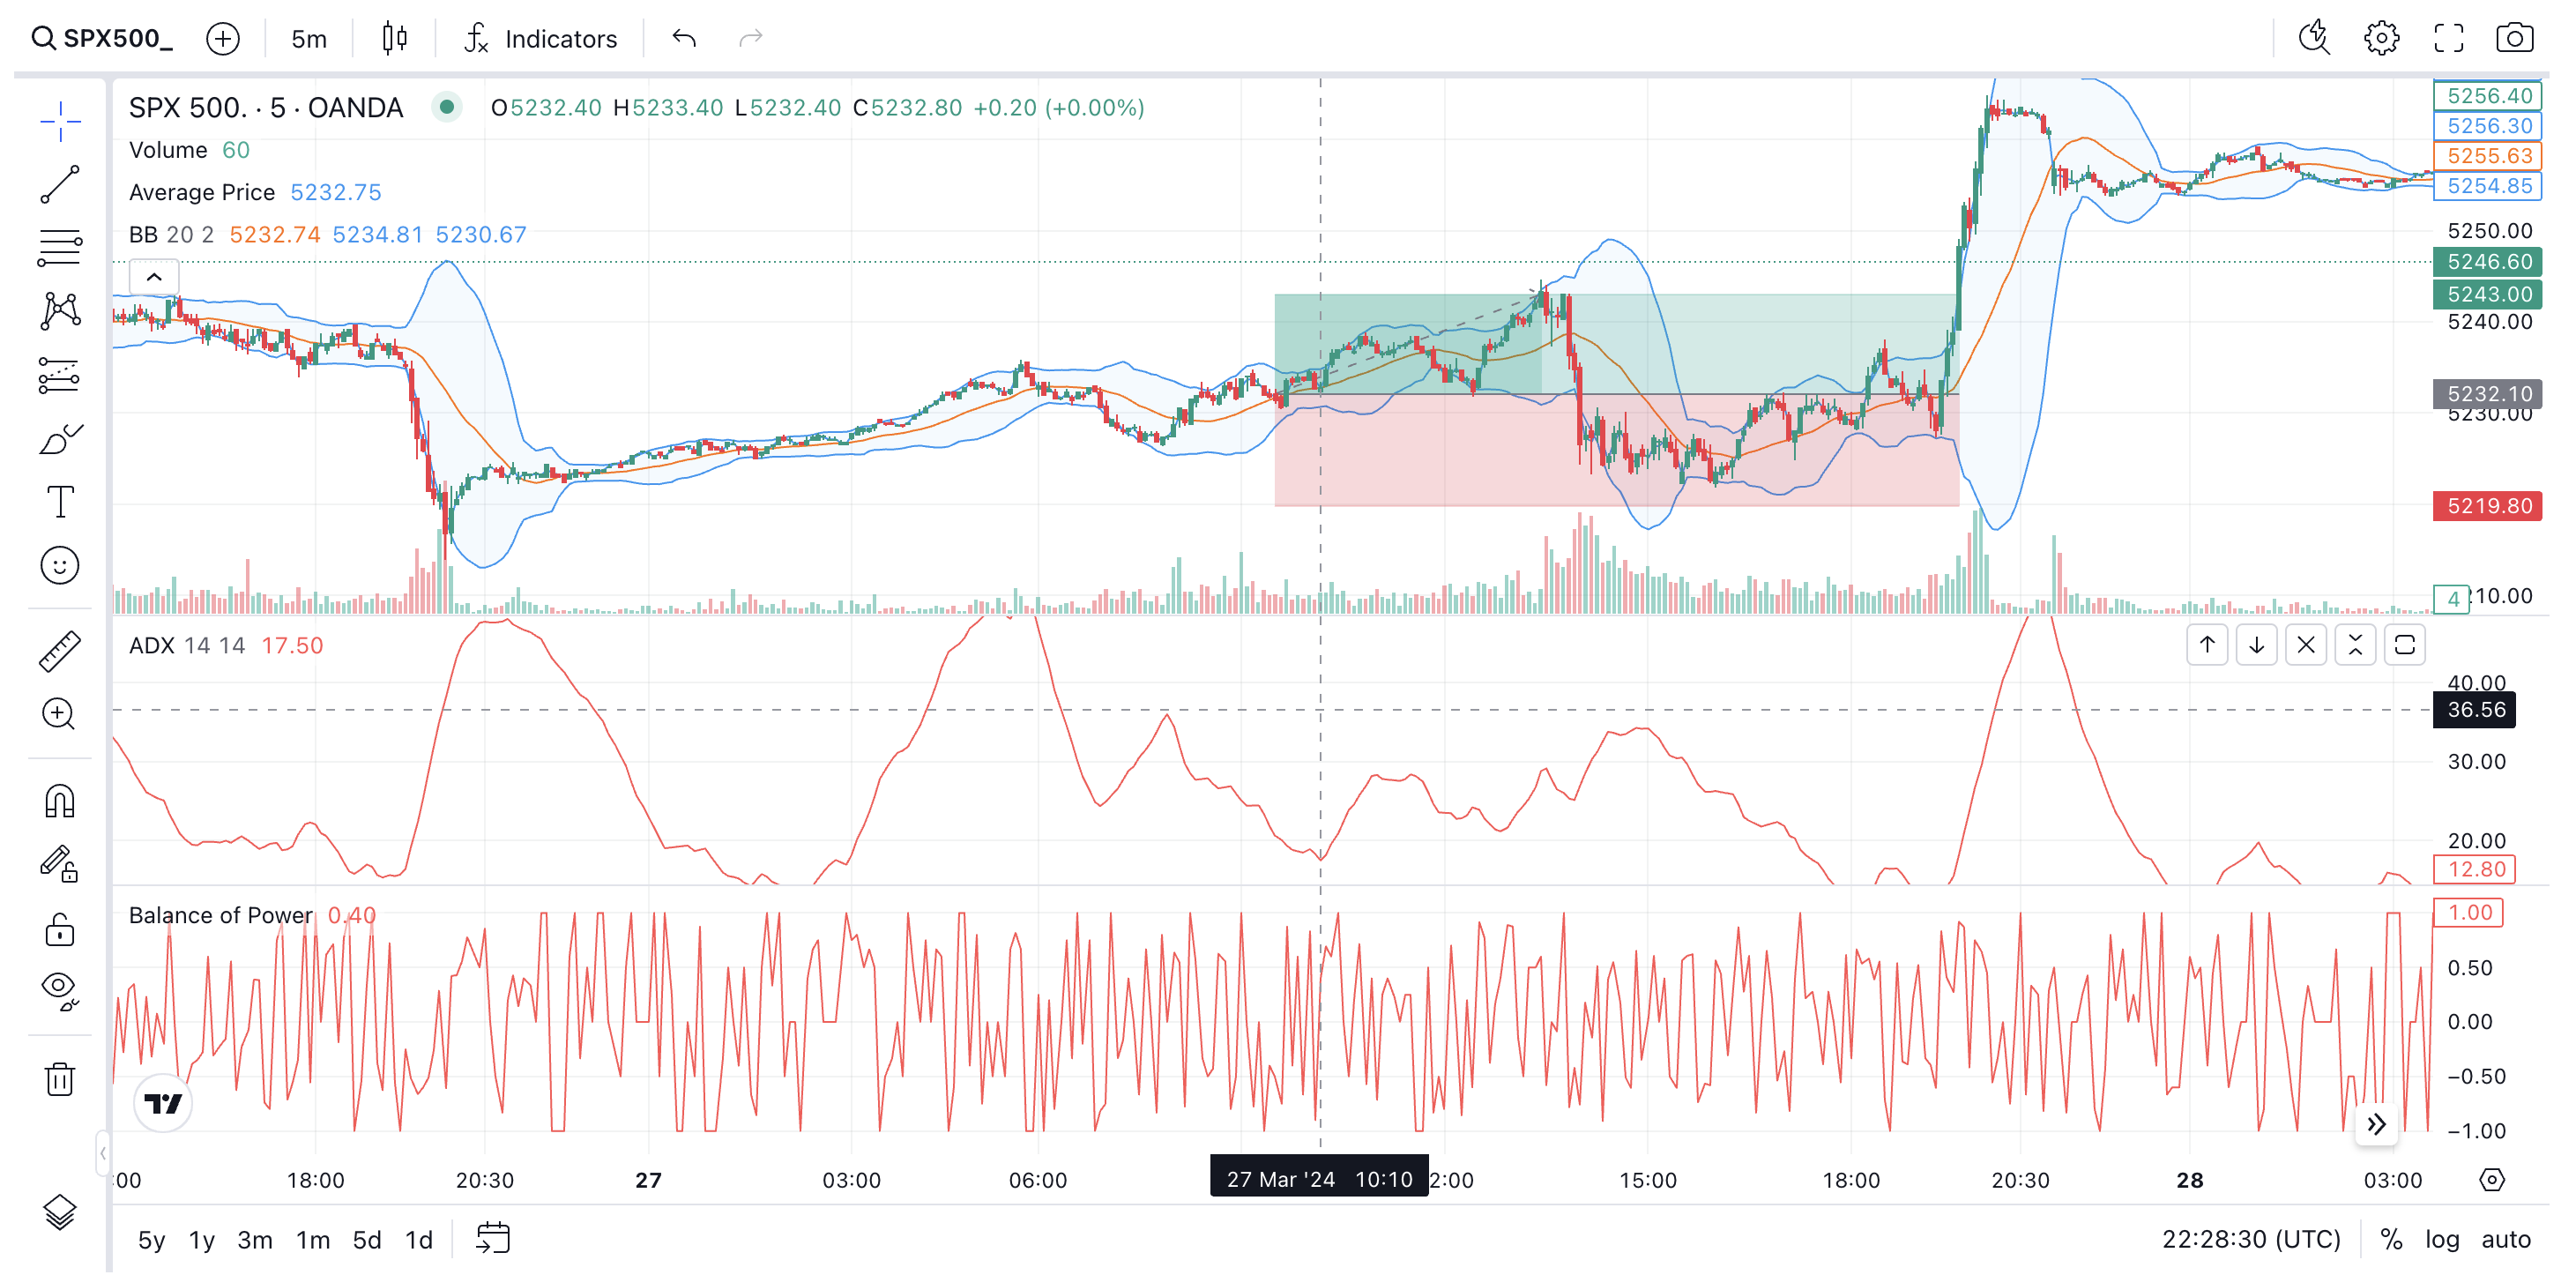
The Same World-Class Charting Experience Built into TradeWise
Multiple Timeframes
Access a wide range of timeframes to conduct thorough market analysis and make informed decisions.
Multiple Chart Types
Multiple chart types including Candlesticks, Bars, Area, Line, Baseline, Hollow Candles, and Heikin Ash.
Trades Plotted
Your trades are plotted automatically, allowing you to instantly visualize your trades!
Drawing Tools
Annotate charts your way with over 50 different smart drawing tools including trend lines, Fibonacci levels, and even Elliott waves!
Unlock the Full Potential of TradingView Advanced Charts!
Enhance your market analysis with our extensive collection of over 100 TradingView technical indicators. Tailored for both novice traders and market veterans, our platform integrates seamlessly with TradingView, offering unparalleled insights and analytics.
Explore everything from classic trend indicators to sophisticated oscillators, volume measures, and beyond. With the TradingView interface you are used to, you can easily navigate through the vast array of tools to find exactly what you need for your trading strategy.
| 52 Week High/Low |
| Accelerator Oscillator |
| Accumulation/Distribution |
| Accumulative Swing Index |
| Advance/Decline |
| Arnaud Legoux Moving Average |
| Aroon |
| Average Directional Index |
| Average Price |
| Average True Range |
| Awesome Oscillator |
| Balance of Power |
| Bollinger Bands |
| Bollinger Bands %B |
| Bollinger Bands Width |
| Chaikin Money Flow |
| Chaikin Oscillator |
| Chaikin Volatility |
| Chande Kroll Stop |
| Chande Momentum Oscillator |
| Chop Zone |
| Choppiness Index |
| Commodity Channel Index |
| Connors RSI |
| Coppock Curve |
| Correlation - Log |
| Correlation Coefficient |
| Detrended Price Oscillator |
| Directional Movement |
| Donchian Channels |
| Double EMA |
| Ease Of Movement |
| Elder's Force Index |
| EMA Cross |
| Envelopes |
| Fisher Transform |
| Guppy Multiple Moving Average |
| Historical Volatility |
| Hull Moving Average |
| Ichimoku Cloud |
| Keltner Channels |
| Klinger Oscillator |
| Know Sure Thing |
| Least Squares Moving Average |
| Linear Regression Curve |
| Linear Regression Slope |
| MA Cross |
| MA with EMA Cross |
| MACD |
| Majority Rule |
| Mass Index |
| McGinley Dynamic |
| Median Price |
| Momentum |
| Money Flow Index |
| Moving Average |
| Moving Average Adaptive |
| Moving Average Channel |
| Moving Average Double |
| Moving Average Exponential |
| Moving Average Hamming |
| Moving Average Multiple |
| Moving Average Triple |
| Moving Average Weighted |
| Net Volume |
| On Balance Volume |
| Parabolic SAR |
| Pivot Points Standard |
| Price Channel |
| Price Oscillator |
| Price Volume Trend |
| Rate Of Change |
| Ratio |
| Relative Strength Index |
| Relative Vigor Index |
| Relative Volatility Index |
| SMI Ergodic Indicator/Oscillator |
| Smoothed Moving Average |
| Spread |
| Standard Deviation |
| Standard Error |
| Standard Error Bands |
| Stochastic |
| Stochastic RSI |
| SuperTrend |
| Trend Strength Index |
| Triple EMA |
| TRIX |
| True Strength Index |
| Typical Price |
| Ultimate Oscillator |
| Volatility Close-to-Close |
| Volatility Index |
| Volatility O-H-L-C |
| Volatility Zero Trend Close-to-Close |
| Volume |
| Volume Oscillator |
| Volume Profile Fixed Range |
| Volume Profile Visible Range |
| Vortex Indicator |
| VWAP |
| VWMA |
| Williams %R |
| Williams Alligator |
| Williams Fractal |
| Zig Zag |
Even More Inside!
- Comprehensive Technical Analysis Tools
Access an extensive range of indicators and chart patterns, from Moving Averages to Ichimoku Clouds, empowering your trading decisions with in-depth analysis.
- Advanced Drawing Tools
Utilize advanced drawing tools like Fibonacci retracements, Gann boxes, and Elliott Waves to map and visualize market movements with precision.
- Advanced Price Scaling
Up to 8 price scales on one chart with different types such as log percentages.
- Multi-Timeframe Analysis
Analyze multiple timeframes to get a comprehensive view of market trends.
- Flexible Styling
Flexible styling lets you customize your charts your way!
Market analysis is facilitated with charts by TradingView, a global platform supplying market data, charting tools, and more.
Browse markets in the stock screener, prepare deals with the latest news and market insights from fellow traders and researchers.